home
download
introduction
quick start
how to
reference
scripting
javadoc
repository
troubleshooting
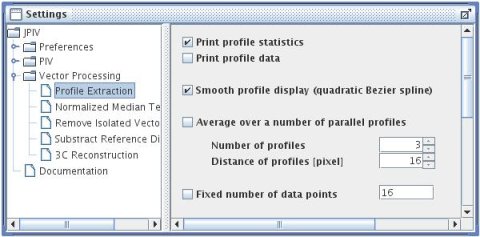
settings-panel: Vector Processing - Profile Extraction.
A profile is velocity data that is interpolated along a line. To create a profile, display a velocity field by double clicking a link in the "Files" window. Display the context menu by right clicking somewhere on the vector plot. Select draw profile line. Set the first end point of your velocity profile with the left mouse button. Keep the button pressed and drag the mouse to draw a line. Release the mouse button to mark the end point of the profile. The velocity field is interpolated along the line.
Print profile statistics
Select this option to print the coordinates and the length of the profile into the "Cmd" frame.
Print profile data
Prints the interpolated data into the "Cmd" frame, when selected.
Smooth profile display (quadratic Bezier spline)
Instead of drawing a straight line from point to point, uses a parabolic fit for nicer display.
Average over a number of parallel profiles
If the print profile data is also selected, the data of a number of parallel profiles and the data of the average profile will be plotted to the "Cmd" frame. Use the next two text fields to specify the number and distance of the profiles.
Fixed number of data points
The distance of the datapoints along the profile line is determined by the grid density and the direction of the profile. Profiles of different length will have a different number of nodes and are therefore difficult to compare. To get always the same number of nodes, you can select this option and specify the number of nodes in the text field.