home
download
introduction
quick start
how to
reference
scripting
javadoc
repository
troubleshooting
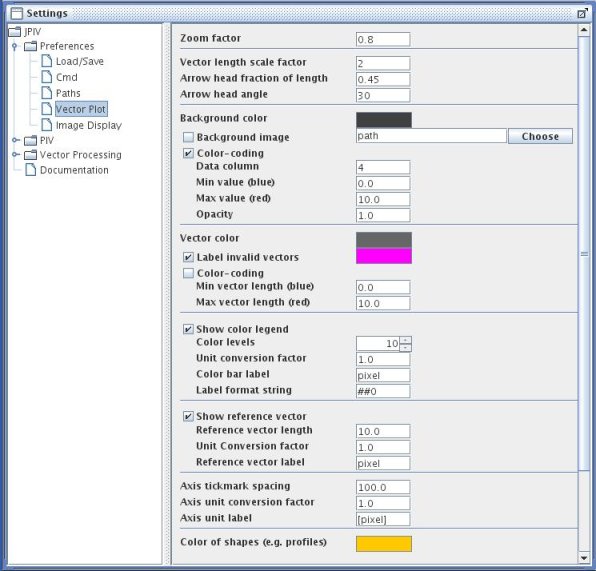
settings-panel: Preferences - Vector Plot.
Zoom factor
The vector plot will be scaled up or down by this floating point factor. For single pixel ensemble correlation files, use a high scaling factor, like 5.
Vector length scale factor
The length of the plotted vector components will be scaled by this factor.
Arrow head fraction of length
The portion of the vector length that will be made up by the arrow head.
Arrow head angle
The angle of the arrow point.
Background color
Click the field to select a default color for the vector field background. This color will be used, if the backgound image options is not selected.
Background image
Use the specified pixel-image as background instead of a uniform color.
Color-coding
Additionally plot some color-coded information in the background (e.g. vorticity, peak to noise ratio etc.). In the text field below, choose the number of the data column of your PIV-data that contains the information (note: column numbering starts with zero). Specify the scaling range of the color coding in the next two text boxes of this section. The transparancy of the color can be set in the last text field of this section. A value of 0.0 means completely transparent, a factor of 1.0 means completely opaque. Also have a look at the color legend option further down on this panel.
Vector color
Click the field to select a uniform default vector color. This color will be used, if color-coding is not selected.
Label invalid vectors
If selected, all vectors whose fifth column value is smaller or equal to zero are labelled with the specified color.
Color-coding
Select this field to use a color code for the vector length. Specify the scaling range in the next two text fields. Also have a look at the color legend option further down on this panel.
Show color legend
Select this option to plot a color bar at the right side of the vector plot. The color bar may refer to the color coding of the vector length or the color coded background. This depends on your selection further upwards. If both options are activated, the color coded background gets priority over the vector length color coding.
The number of distinct color levels can be set in the first text field.
The next text field is used to define a unit conversion factor. This factor can be used to adapt the vector length and the color bar labels to match a certain unit. Example for color coded vector lenght: Your data file contains all displacements in pixel. When the magnification of your optics is 10x, the pixel size of your camera is 6.45 micrometers, and the time between your image exposures is 5 milliseconds, the scaling factor 0.129 (pixelsize/(magnification x dt)) will convert the vector length and color bar labels from from pixel to mm/s. The same factor is used further down to scale the reference vector. You may specify two different scaling factors for the color bar and the reference vector, if the color bar refers to the background color coding.
The color bar label text box contains a string that is printed below the text box.
The last text field in this section is used to format the labels next to the color bar tickmarks. Example: 00 prints exactly two digits, #0.00 prints at least one digit in front of the decimal dot and exactly two digits after the decimal dot. Default is the scientific notation with at least one digit before the decimal dot and exactly three digits after de decimal dot: ##0.000E00
Show reference vector
Select this option to plot a reference vector in the upper, left corner of the vector field. The lenght of the reference vector is specified in the first text field of this section. You should you use real units here. The effective reference vector length will be the value in this field times the vector length scaling factor divided by the unit conversion factor. The unit conversion factor may be calculated like explained in the section about the color legend further up. The last text field in this section contains a string that will be plotted next to the reference vector together with the vectors specified length.
Axis tickmark spacing
The spacing between the tickmarks in real units, meaning that this value should be set according to the axis unit conversion factor in the next field. Example: If your data files contains all values in pixel, but you want to have the axis in mm, divide the pixel size of your camera by the magnification of your optics to get the conversion factor. For a pixel size of 6.45 micrometers and a magnification of 10x, an axis unit conversion factor of 0.000645 will convert the axis into mm. For the tickmark spacing, a value of 0.1 or 0.2 (mm) might be a good choice then.
The content of the last field will be plotted at the end of the axes.
Color of shapes (e.g. profiles)
Click to select a color for profiles. Profiles can be drawn into a vector plot via the context menu of a vector plot frame.